Projects
CO2-SMART

The CO2 Storage, Modeling, Analytics, and Risk Reduction Technology (CO2-SMART) is a Phase-I National Science Foundation Industry-University Cooperative Research Center (IUCRC; award info here), at the University of Southern California (as the lead site) and the Pennsylvania State University (as the second site). CO2-SMART aims to accelerate safe and cost-effective deployment of commercial-scale geologic CO2 storage through industry-driven research, workforce development, and outreach activities. The Center brings together the industry, government and academic stakeholders from energy, environment, and technology sectors to create a collaborative research program focused on addressing the high-priority needs of the industry in geologic CO2 storage. Some of the key objectives of the center include:
- De-Risking geologic CO2 storage projects through technological advancement
- Evaluating and incorporating new CO2 storage economic/regulatory frameworks
- Accelerating impact and tech-transfer by collaborative engagement with industry
- Leveraging AI and data science for improved automation and decision support
- Developing and training next-generation leaders for CO2 storage implementation
- Increasing public awareness/acceptance of CO2 storage via education & outreach
Integration of seismic-pressure-petrophysics inversion of continuous active source seismic monitoring data for monitoring and quantifying CO2 plume
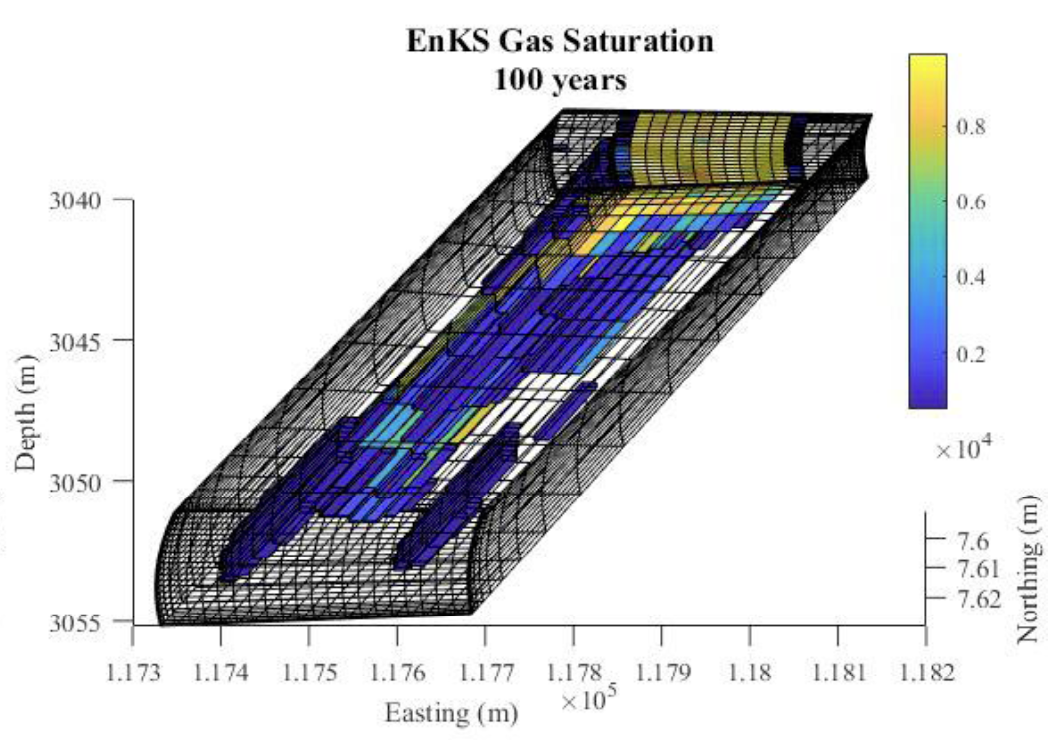
This project developed and validated an integrated package of tools for the joint seismic-pressure-petrophysics inversion of continuous active-source seismic monitoring (CASSM) data. The CASSM system is capable of providing real-time monitoring of a carbon dioxide (CO2) plume during geologic carbon storage, and the tools developed in this project extend the utility of this crosswell monitoring system to estimate plume properties in the 3D reservoir. The resulting real-time map of CO2 saturation obtained using this process will provide a deeper understanding of the complex, time-varying dynamics of the subsurface fluid flow migration path, as well as the rapid detection of potential CO2 leakage.
Virtual Asset

An R Shiny app for viewing Marcellus shale gas production data and timing of (re-)fracking events. It also allows one to interact with the research of one of my Master’s students, Zhenke Xi, in which he couples decline curve analysis with geostatistics to predict EUR and production rates over the domain of the Marcellus. Details of the analysis are in Xi and Morgan (2019).